
There are many candlestick patterns that indicate price reversals, continuations, and sideways movement. These are a few commonly occurring patterns to keep an eye out for.
REVERSAL PATTERNS
HAMMER / HANGING MAN
Hammers and hanging men are single candle patterns, thus they both require further confirmation such as increased trading volume before they can be acted upon.
HAMMER
Hammers are bullish reversal patterns consisting of a short body and long lower wick. They usually form at the bottom of a downward trend and suggest that buyers will soon regain control of the market. Hammers can be either green or red, but green hammers indicate a stronger potential for a bull market.

HANGING MAN
A hanging man takes the same shape as a hammer but instead indicates a bearish reversal. Hanging men usually form at the peak of an upward trend and suggest that sellers will soon regain control of the market.

INVERTED HAMMER / SHOOTING STAR
Like hammers and hanging men, Inverted hammers and shooting stars are both single candled patterns that require additional confirmation before action can be taken.
INVERTED HAMMER
Inverted hammers are bullish reversal patterns consisting of a short body and long upper wick. They usually form during prevailing downtrends and indicate that selling pressure isn’t strong enough to drive market prices lower. Inverted hammers suggest that buyers will soon regain control of the market, marking the beginning of an upward trend.
SHOOTING STAR
Shooting stars take the same shape as inverted hammers, however they indicate a bearish reversal. They usually form during an uptrend and consist of a short body and a long upper wick. Their formation resembles a falling star of sorts, hence the name. Shooting stars demonstrate the ability of sellers to drive prices lower and may indicate a future downtrend.

ENGULFING PATTERNS
Bullish and bearish engulfing patterns both feature a short bodied candle “engulfed” by a larger candle. These two-candled patterns can signal a trend reversal depending on the location of the pattern within a trend and its candlestick color combination.
BULLISH ENGULFING
Bullish engulfing patterns usually form at the end of a downward trend. They consist of a short red bodied candle followed by a long green bodied candle which completely overlaps or engulfs the red candle. Bullish engulfing patterns indicate that buyers are assuming some control over the market, and there is a potential for an uptrend.

BEARISH ENGULFING
Conversely, bearish engulfing patterns usually form at the end of an upward trend. They consist of a short green bodied candle followed by a long red bodied candle which completely overlaps or engulfs the green candle. Bearish engulfing patterns indicate that sellers are assuming some control over the market, and there is a potential for a downtrend due to the slowdown in price movement.
HARAMI PATTERNS
Harami are two candlestick patterns which are similar to engulfing patterns. The main difference is that the long candle forms 1st, followed by a short candle forming within the range of the long one.
BULLISH HARAMI
Bullish harami typically form at the end of a downtrend and consist of a short bodied red candle laying inside the previous green bodied candle. This indicates price consolidation after a downward movement or a pause in the current trend due to seller indecision. These formations are difficult to act on alone, but they may be indicative of an upward price reversal.

BEARISH HARAMI
The inverse is the bearish harami which typically forms at the end of an upward trend or a pullback thereof, and consists of a short bodied green candle laying inside the previous red bodied candle. This indicates price consolidation after an upward movement or a pause in the current trend due to buyer indecision. These formations are difficult to act on alone, but they may be indicative of a downward price reversal.

PIERCING LINE / DARK CLOUD COVER
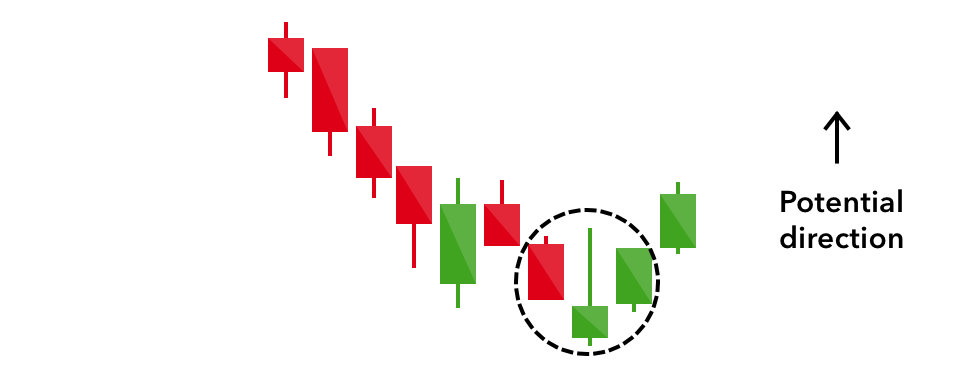
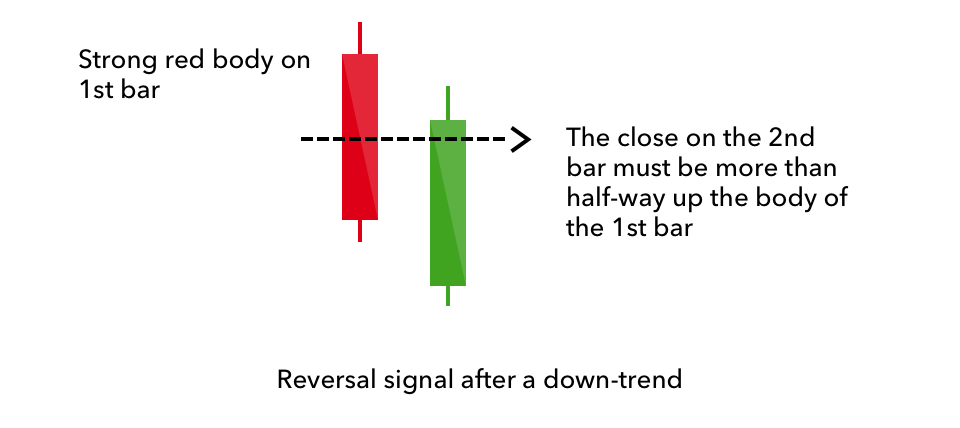
PIERCING LINE
Piercing lines are two-candled bullish reversal patterns. They consist of a long red candle followed by a long green candle with a significant gap between the red candle’s close price and green candle’s open price. This formation indicates strong buying pressure as the market price climbs to the mid-price levels or higher of the previous candlestick.
DARK CLOUD COVER
The opposite of the piercing line formation is the dark cloud cover formation. Dark cloud cover is a bearish reversal pattern consisting of a long green candle followed by a long red candle with a significant gap between the green candle’s close price and red candle’s open price. This formation indicates strong selling pressure as the market price drops to the mid-price levels or lower of the previous candlestick, forming a “dark cloud” over the previous candle’s optimistic movement.

MORNING STAR / EVENING STAR
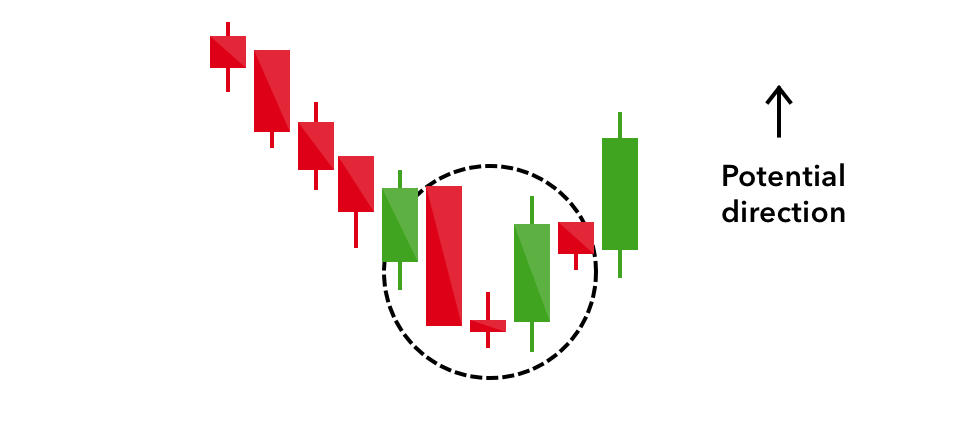
MORNING STAR
Morning stars are three-candled bullish reversal patterns consisting of a short bodied candle or “star” forming between a long red candle and a long green candle. Usually, the star gaps the market open and close price and sits below the neighboring red and green candles. This formation indicates a reduction in selling pressure and a transition towards an upward trend.
EVENING STAR
The bearish reversal equivalent of morning stars, evening stars consist of a star forming between a long green candle and a long red candle. This formation indicates a reduction in buying pressure and a transition towards a downward trend. The formation commands stronger indication when the third candle in the pattern deletes the gains of the 1st candle.

THREE WHITE SOLDIERS / THREE BLACK CROWS
THREE WHITE SOLDIERS
“Three white soldiers” are three-candled bullish reversal patterns consisting of three consecutive long green candles with minimal wicks. They usually occur at the end of a downtrend and show a strong upward price movement as buyers assume control of the market, marking the beginning of an upward trend.

THREE BLACK CROWS
“Three black crows” are three-candled bearish reversal patterns consisting of three consecutive long red candles with minimal wicks. They usually occur at the end of an upward trend and show a sharp downward price movement as sellers assume control of the market, marking the beginning of a sustained downward trend.

NEUTRAL PATTERNS
DOJI / SPINNING TOPS
DOJI
Doji have non existent bodies and look like crosses or + signs. They represent a tug of war or standoff between buyers and sellers and indicate no net gain in buying or selling pressure. Doji are neutral signs on their own and can command bullish or bearish bias based on the preceding price action. Doji are often spotted in other pattern types therefore, further trend confirmation is usually required before action can be taken.

SPINNING TOP
Spinning tops are similar to Doji however they have small bodies with wicks of equal lengths giving them the appearance of a spinning top. They are also neutral signs and indicate a period of rest with no major price movements during marketplace indecision.

CONTINUATION PATTERNS
RISING THREE METHODS
The “rising three methods” bullish continuation pattern is a five-candled pattern consisting of three consecutive short red candles in between the range of two long green candles. It is indicative that buying pressure will be sustained regardless of slight interim selling pressure. During the formation, a new low price is not observed and buyers maintain control of the marketplace, suggesting a continuation of the uptrend.

FALLING THREE METHODS
The “falling three methods” is the bearish continuation pattern equivalent of the “rising three methods” pattern. It consists of three consecutive short green candles in between the range of two long red candles. It is indicative that selling pressure will be sustained regardless of slight interim buying pressure. During the formation, a new high price is not observed and sellers maintain control of the marketplace, suggesting a continuation of the downward trend.
