
CHART PATTERNS
Price patterns or chart patterns are used in technical analysis to forecast price movements based on a series of recognizable trend lines and curves on a price chart. Depending on the pattern’s formation and characteristics, they can indicate trend continuations or reversals.
CONTINUATION PATTERNS
Continuation patterns form during a temporary interruption of a prevailing price trend. Once the pattern formation is completed and a breakout occurs, prices tend to resume along the prevailing trendline. The longer a continuation pattern takes to form, the more drastic a price breakout tends to be. There are many types of continuation patterns but triangles, rectangles, flags, pennants, wedges, and cups and handles are among the most commonly traded patterns.
TRIANGLES
Triangle chart patterns illustrate the compression of an asset’s price into a narrower area. They commonly occur on short-term time frames and can be used to identify entry points, stop losses, and price targets. Triangles are sorted into three basic categories – ascending, descending, and symmetrical. They are constructed by plotting a horizontal line in tandem with an ascending support or resistance line. As compression forces the price into the apex of the triangle, price action is constrained – setting the stage for a breakout. Although these triangle continuation patterns are traded slightly differently, the mechanics of triangle continuation patterns are identical.
ASCENDING
Ascending triangles are bullish patterns and indicate the continuation of an upward trend. Ascending triangles are plotted by placing a price resistance line along the swing highs and an ascending support line along the swing lows.

DESCENDING
Descending triangles are bearish patterns and indicate the continuation of a downward trend. The mechanics of a descending triangle is identical to that of an ascending triangle however, they are used to identify price breakdowns and short position entry points.

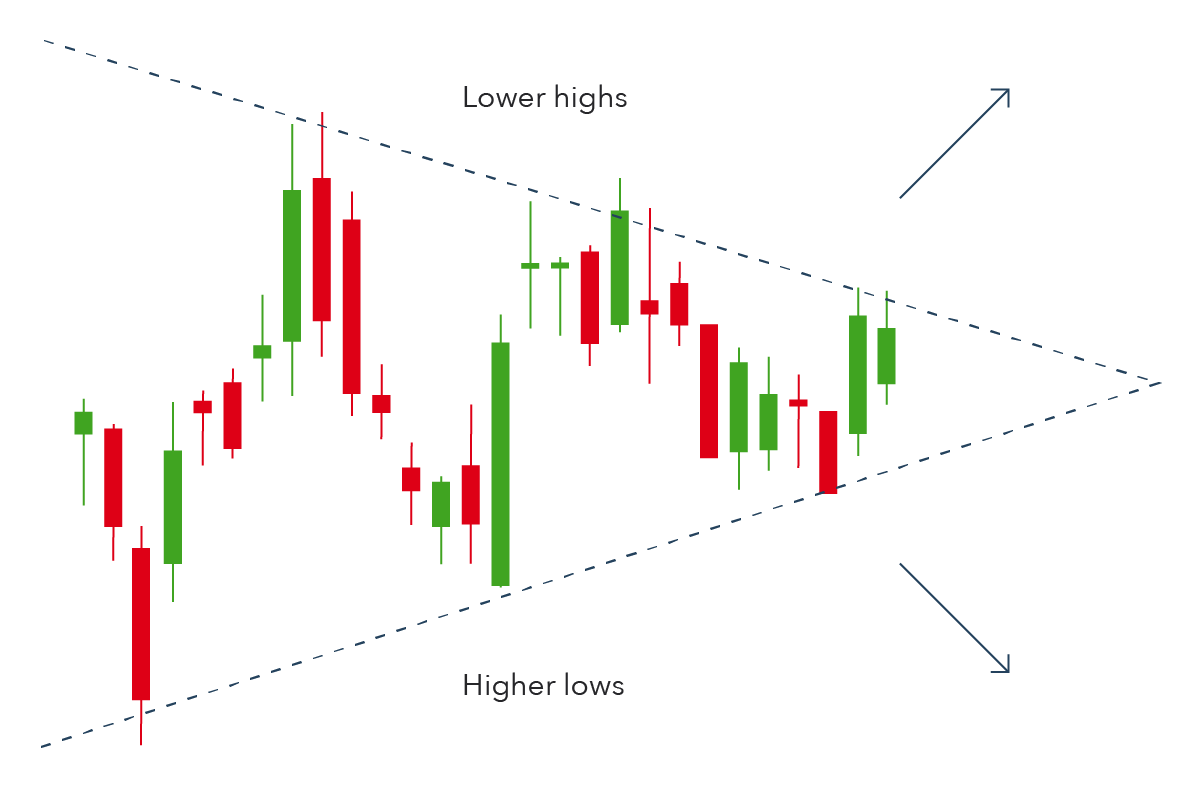
SYMMETRICAL
Symmetrical triangles can be used to track compression and identify a potential breakout point, however, it is difficult to project the direction of a breakout when using symmetrical triangles.
RECTANGLES
Rectangles illustrate a pause in the overall price trend resulting in sideways price action. Rectangles are similar to price channels and are plotted between parallel support and resistance lines. In addition, they can be traded like a price channel in which long and short positions can be initiated as the price bounces off the support and resistance lines.

FLAGS
Like rectangles, flags also illustrate a pause in a general price trend, but flags usually occur over a shorter time period. Flags represent a compressed trading range following a drastic price movement. They can be ascending, descending, or flat. Usually, ascending flags represent a pause in a general downward trend and descending flags represent a pause in a general upward trend. Flags are often formed in tandem with a brief decline in trading volume.
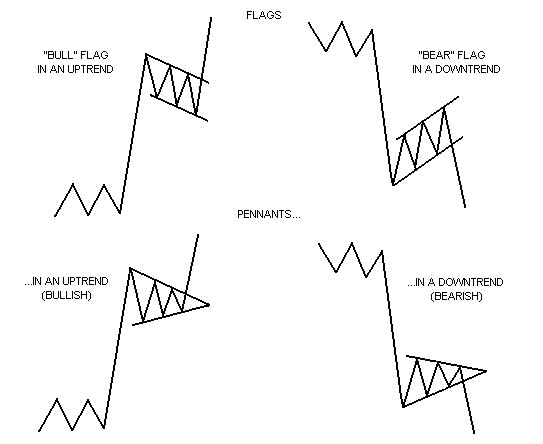
PENNANTS
Pennants can be used to represent a continuation or reversal of a general trend. Pennants are illustrated with converging upward and downward trend lines with a horizontal centerline. It is common to see a decrease in trading volume during the formation of a pennant pattern accompanied by an increase in trading volume succeeding a price breakout.

WEDGES
Wedges form when an asset’s price is compressed between two upward or downward slanted lines. Wedges are usually indicative of a temporary price reversal during a general trend.
RISING WEDGES
Rising wedges are angled upward and generally indicate a future decline in price once the support level is broken.

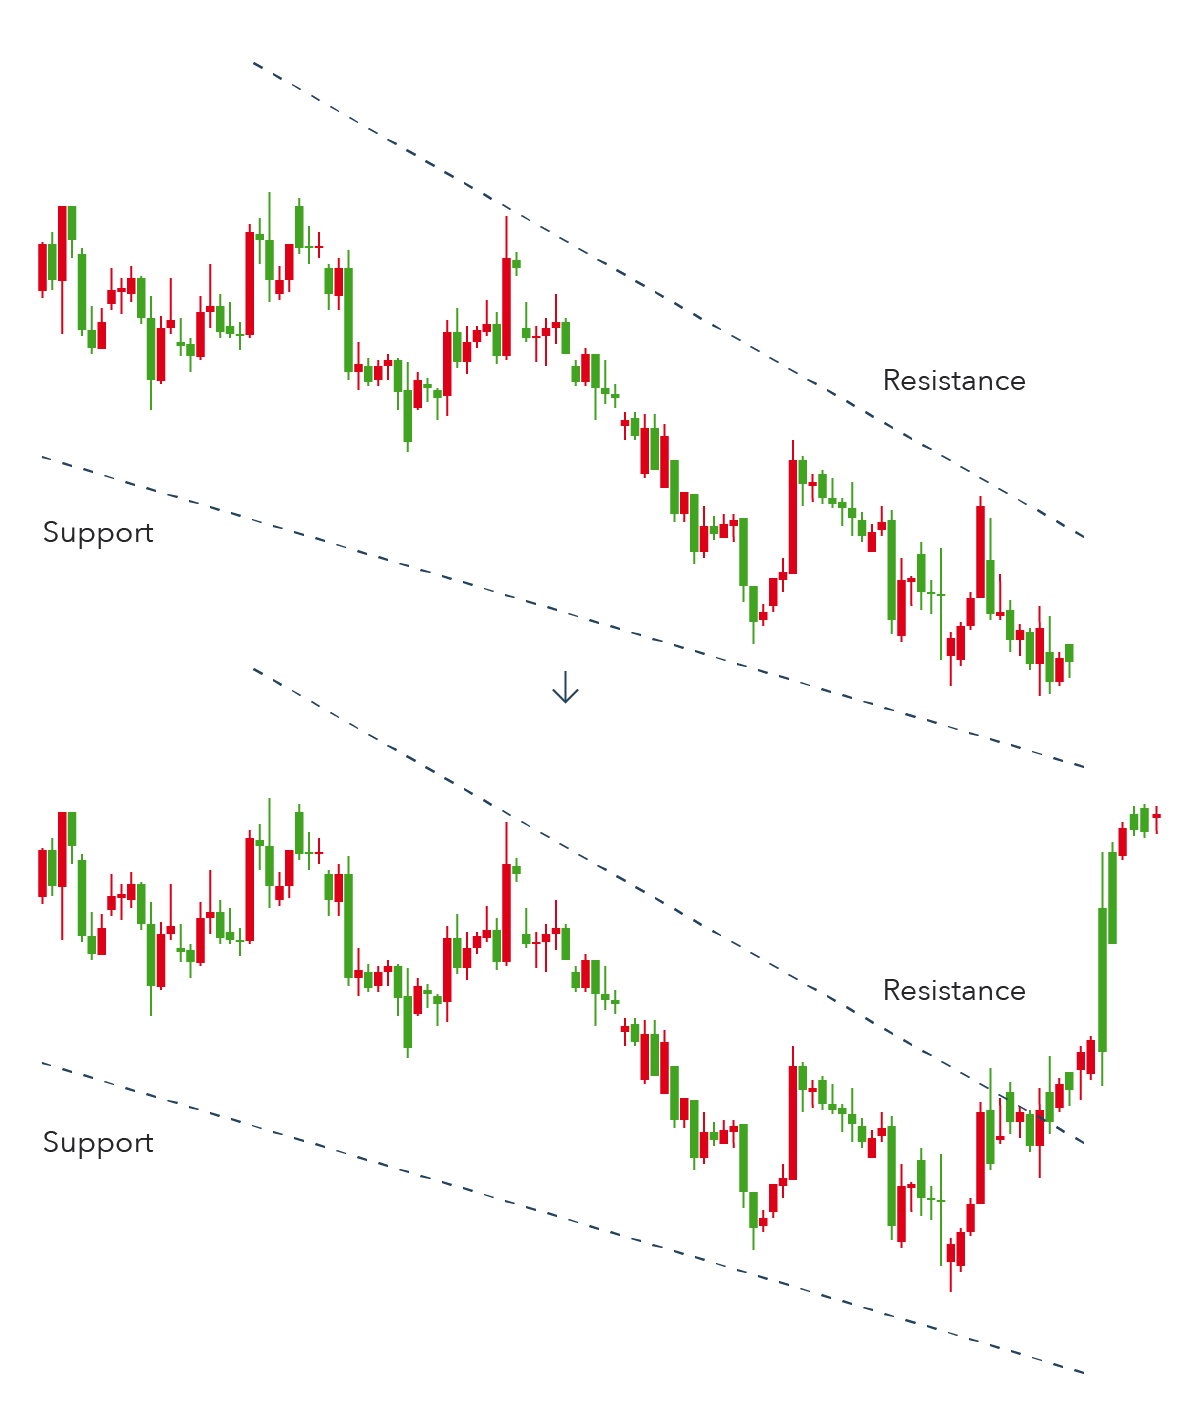
FALLING WEDGES
Conversely, falling wedges are angled downward and generally indicate a future rise in price or continuation of a bullish trend once the resistance level is broken.
CUP AND HANDLE
A cup and handle is a bullish continuation pattern which combines components of a rounding bottom pattern and wedge patterns. An asset’s price might enter a temporary price retracement in the form of a falling wedge (handle) succeeding a rounding bottom (cup) pattern. Once a price emerges from the handle, it will usually continue on the original upward trend.

REVERSAL PATTERNS
Reversal patterns form during a period in which a prevailing price trend is changing direction. Once the pattern formation is completed and a breakout occurs, prices tend to move in the opposite direction of the previous prevailing trendline. Like continuation patterns, the longer a reversal pattern takes to form, the more drastic a price breakout tends to be. There are many types of reversal patterns but head and shoulders, double tops, double bottoms, and gaps are among the most commonly traded patterns.
HEAD AND SHOULDERS
A head and shoulders pattern forms when a large peak called a head forms between two slightly smaller peaks of similar size called shoulders. These three peaks share a support level called a neckline. A bearish breakdown is likely to occur once the third peak declines to the neckline.

DOUBLE TOPS
Double tops are similar to head and shoulders except they only incorporate two peaks of similar height (the shoulders) and not the central peak (the head). Double tops are considered bearish reversal patterns and occur when a price bounces twice between a support and resistance level before reversing against the overall uptrend. This action forms an “M” shape and represents two failed attempts to breach a resistance level. Double tops indicate the transition between a prevailing uptrend and a downtrend.

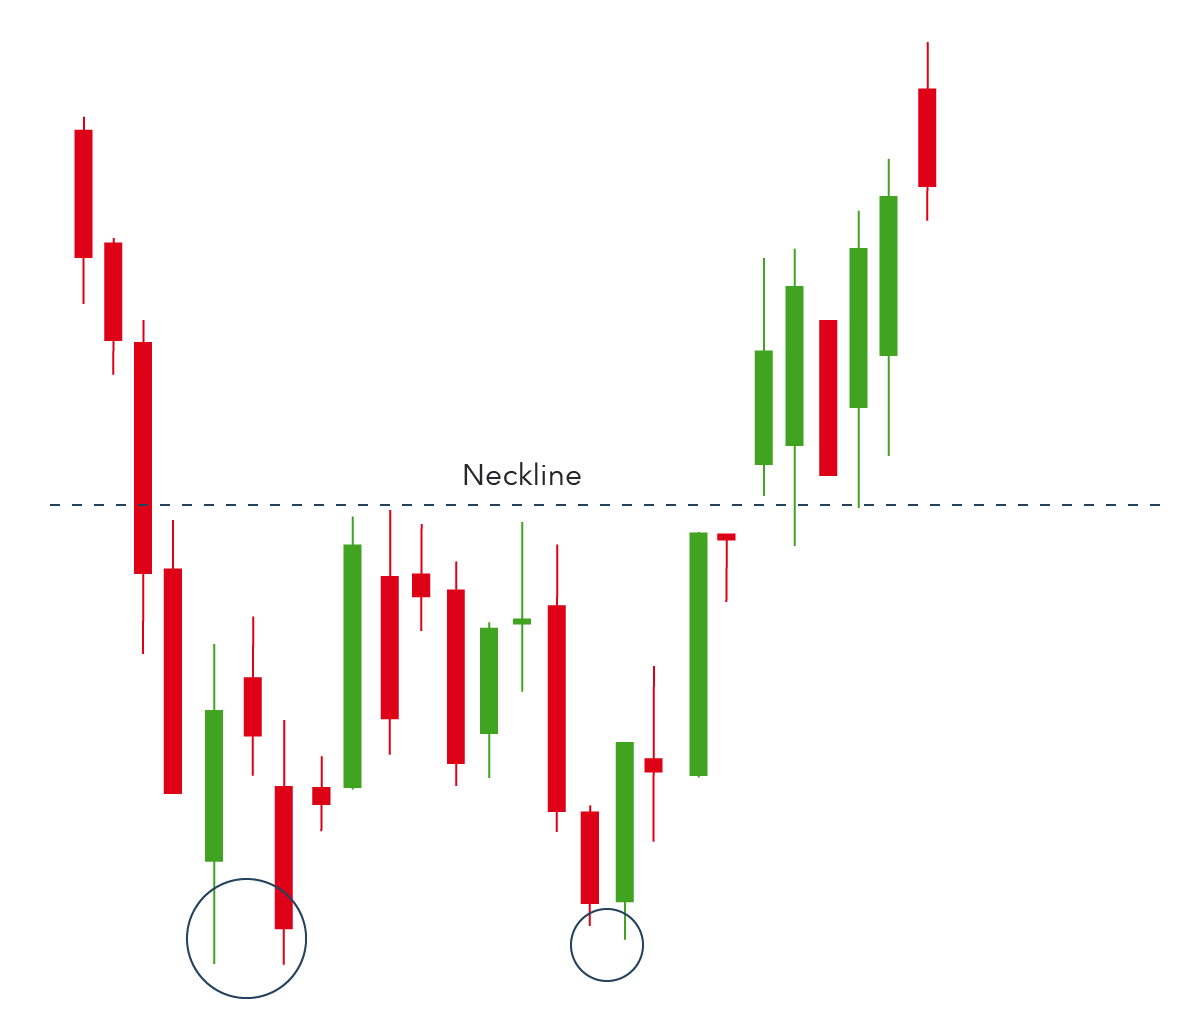
DOUBLE BOTTOMS
Double bottoms are the inverse of double tops are considered bullish reversal patterns. They occur when a price bounces twice between a support and resistance level before reversing against the overall downtrend. This action forms an “W” shape and represents two failed attempts to breach a support level. Double bottoms indicate the transition between a prevailing downtrend and an uptrend.
GAPS
Gaps indicate significant price movements with minimal trade volume and represent the change in the previous close and open price. Gaps are usually caused by technical factors such as unexpected earnings reports, news, or announcements but can also occur naturally. Gaps can signal different things depending on when they occur within a price pattern. Although there are several types of gaps, the most tradable ones are generally classified as breakaway, runaway, and exhaustion gaps.
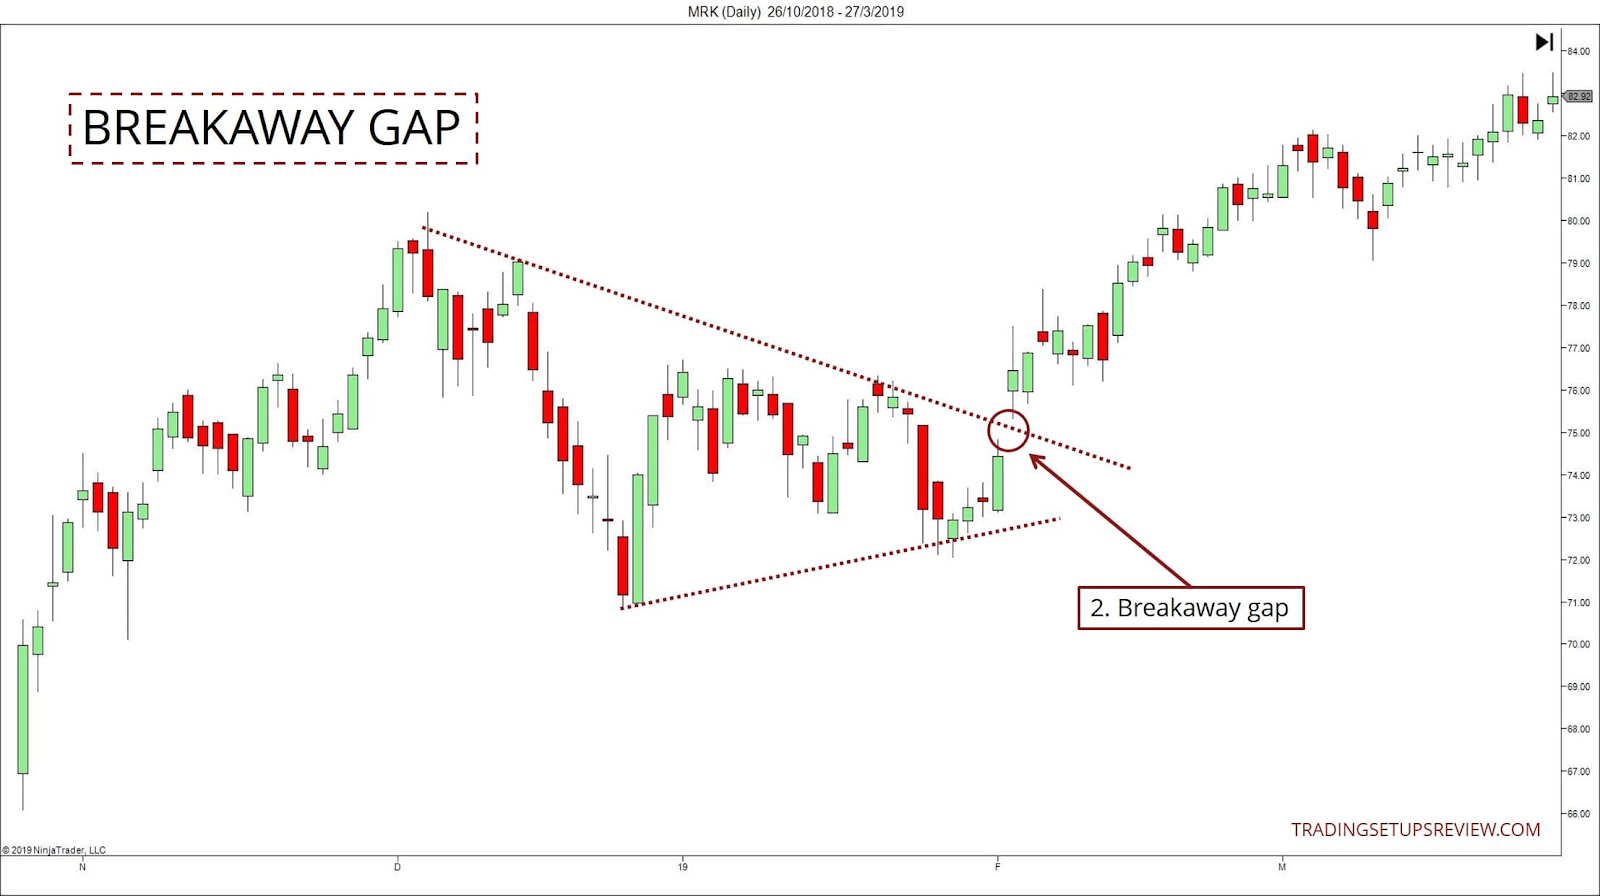
BREAKAWAY GAPS
Breakaway gaps occur when a price gaps above an established range or chart pattern, breaching a major support or resistance level. Breakaway gaps are usually indicative of a new trend confirmation or price reversal and are more reliable when high volume is present.
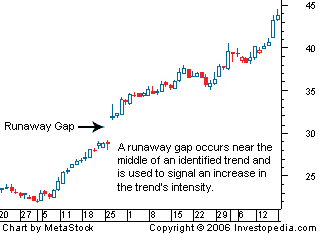
RUNAWAY GAPS
A runaway or continuation gap occurs in the same direction and within an established trend, often trailing a breakaway gap. Runaway gaps often signify a longer term continuation of a trend in the same direction.
EXHAUSTION GAPS
Exhaustion gaps generally manifest at the end of a prevailing trend usually proceed a trend reversal. The term exhaustion refers to the declining number of buyers being overtaken by a significant number of sellers entering the market. Exhaustion gaps typically occur after an extended uptrend and feature a significant gap between previous low and the high of the current trading period accompanied by above average trading volume.
